General Usage
Integrated Help
Just press F1 to open a dedicated help window with comprehensive documentation right at your fingertips. This built-in help system contains detailed articles for every method and feature, so you never have to leave your workflow to find answers.
The help system covers every topic you’ll encounter, with particularly rich documentation for the Custom Experiment Builder. Whether you’re getting started or diving into advanced features, you’ll find clear explanations and practical guidance tailored to your current context.
Want the latest updates? Visit https://doc.zahner.de/im7 for the most current documentation, while your Zahner Lab installation includes help content specific to your version for guaranteed compatibility.
Exporting Datasets
You can export datasets using the File menu, context menu or simply by dragging and dropping them.
When you have both the Lab and File Explorer open, just drag datasets from the Lab and drop them into your desired directory.
You can also export entire folder structures, each containing multiple datasets, via the File menu or context menu.
Analyzing Data
You can analyze data using the Zahner Analysis software. Exported datasets can be opened in the Analysis software for further processing and visualization.
You can also drag and drop datasets directly from the Lab into the Analysis software for immediate analysis.
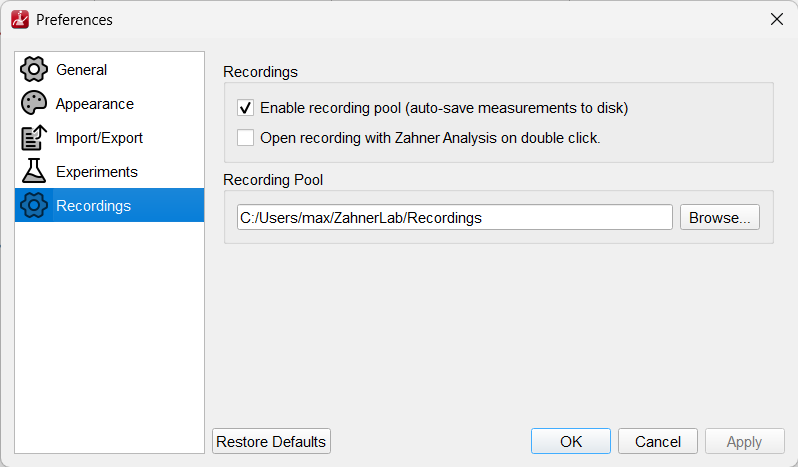
Recording Pool
The Recording Pool automatically saves measurement data to disk in the background while your experiment is running. This protects your data against unexpected events such as power outages, system crashes, or accidental shutdowns.
Zahner Lab uses an adaptive save interval that starts at 100 ms and gradually doubles up to a maximum of 30 seconds for long-running measurements. This keeps the saved data closely up to date - especially during the critical early phase of a measurement - while avoiding unnecessary disk load over extended run times.
During a measurement, data is stored as a temporary .live file. Once the measurement is complete, the .live file is replaced with the final dataset in its own folder. You can open this location by clicking the folder icon next to the Recording Pool.

The Recording Pool is enabled by default. You can change the storage location or disable it in the Preferences to conserve system resources, for example on less powerful computers or when disk I/O is limited.
Dashboards
For each method, you can choose from 9 different dashboards that can be tailored exactly to match your personal preferences. You can switch between dashboards using the 9 icons shown in the screenshot below or by pressing the number keys 1-9 on your keyboard.

Zahner Lab gives you complete freedom to design your workspace layout. You have full control over what content is displayed and how it appears, so you can create the perfect setup for your specific workflow and analysis needs.
You can edit any dashboard using the pen icon on the right, and share your configurations with colleagues using the export and import icons on the left. The icon with the two arrows rescales your plots back to their original view if you’ve zoomed in on any axis.
Sliding Window
The sliding window feature lets you focus on the most recent portion of your measurement data - perfect for long-running experiments where you want to monitor current trends without scrolling through the entire timeline.

You can configure the window duration to display exactly the time range that matters most to your analysis, whether that’s the last few seconds or the last several minutes.
As an added benefit, reducing the sliding window size also lowers the number of data points rendered on screen, which can help maintain smooth dashboard performance on less powerful computers.
View Controls
Full-Screen Mode
Press F11 to enter full-screen mode and maximize your available workspace area.
Tab Management
You can undock device tabs for flexible window arrangement:
Double-click on any device tab to undock it into a separate window
Click the close button (X) on an undocked window to dock it back into the main tab bar
This allows you to arrange multiple devices across multiple monitors or organize your workspace according to your preferences
Widget Layout Customization
You can customize the application layout by dragging and dropping different widgets to new positions. For example, the Project and Experiments widgets can be repositioned anywhere within the interface to better suit your workflow.
To rearrange widgets:
Click and hold on any widget’s title bar
Drag the widget to your desired location
Drop it in place to lock the new position
The layout will automatically save your preferences
You can also export and import dashboards to share settings across different computers.
Zahner Lab Update System
Keep your Zahner Lab up to date to take advantage of the latest features, performance improvements, and bug fixes.
Zahner Lab can automatically check for updates each time you launch the application. This option is disabled by default, to enable it, go to Edit → Preferences → General and turn on the automatic update check.
When enabled, Zahner Lab connects to our update server at startup and lets you know if a newer version is available. If an update is found, a notification text appears in the upper-right corner of the welcome screen, simply click it to download and install the update automatically.
You can also check for updates at any time by going to Help → Check for Updates, regardless of your automatic update settings.
If your computer does not have internet access, you can download the latest update manually from zahner.de/service-support on another computer, copy the update file to a USB drive, and install it offline.
Language Settings
Zahner Lab is available in multiple languages. To change the interface language, go to Edit → Preferences → General and select your preferred language from the dropdown menu. The change takes effect after restarting Zahner Lab.